Quantcast
Channel: The SAS Dummy
Viewing all 234 articles
Browse latest View live

Add a stars-style rating column to your SAS output

$
0
0

Now, the Star-Belly Sneetches
Had bellies with stars.
The Plain-Belly Sneetches
Had none upon thars.
- from "The Sneetches", by Dr. Seuss

Recently a user on the SAS-L mailing list had this challenge: "I would like to display stars in a table (created by PROC REPORT) based on variable values. For example, if value=3, then display five stars with 3 in yellow, and the other two in grey."

In her original post, the user had sketched out an approach that used a custom SAS format with uppercase and lowercase Xs representing the desired "star" states. It turns out that this was very close to a working approach. All she needed to do was apply the same technique that I used to add Harvey Balls to a SAS report. Like the Fix-It-Up Chappie, I'm here to offer the solution.

In my Harvey Balls example, I used ODS ESCAPECHAR and Unicode character codes to add extended characters to my SAS format labels. There is a Unicode character for a star (HEX 2605), so the same approach can work. In addition, the ESCAPECHAR sequence can set off style instructions, such as a color definition. This allows you to control the character color "mid-stream". For example, this sequence specifies a red star followed by a gray star:

 ~{style [color=red] ~{unicode '2605'x}} ~{style [color=ygr] ~{unicode '2605'x}}

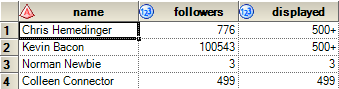
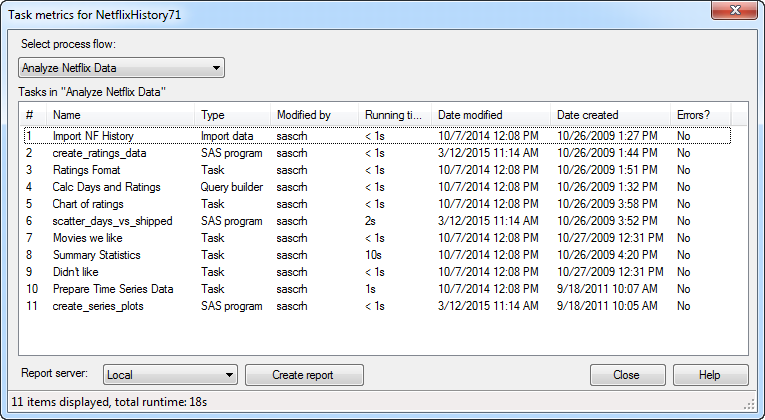
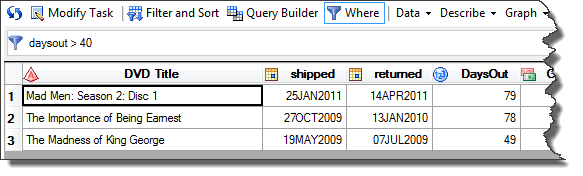
As it happens, I keep some movie rating data that I downloaded from my Netflix account history (a very rich source of trivial SAS examples). When I apply a custom "star" format to my data, I can produce a report like this:
starsthars
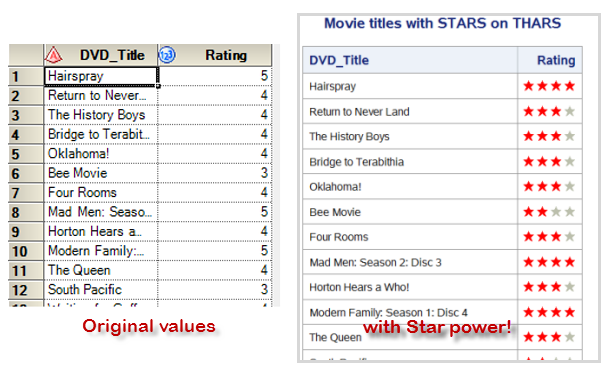
Here's my SAS format and the PROC PRINT code that references it. The format and report look perfect in HTML, PDF and RTF output:
/* ODS EXCAPECHAR needed to set style/unicode cues */
ods escapechar='~';
 
/* Captured these in macro variables for readability and */
/* easy maintenance                                      */
%let graystar = ~{style [color=ygr] ~{unicode '2605'x}};
%let redstar =  ~{style [color=red] ~{unicode '2605'x}};
 
/* using a 4-star system where 1 means "zero stars" */
/* and 5 means the full "4 stars"                   */
proc format lib=work;
value stars
 1 = "&graystar.&graystar.&graystar.&graystar."
 2 = "&redstar.&graystar.&graystar.&graystar." 
 3 = "&redstar.&redstar.&graystar.&graystar." 
 4 = "&redstar.&redstar.&redstar.&graystar." 
 5 = "&redstar.&redstar.&redstar.&redstar." 
;
 
title "Movie titles with STARS on THARS";
proc print data=work.movies noobs;
  format rating stars.;
run;

If you want to try it yourself, you can download my program with test data:

>> Complete SAS program with test data

This program should work in SAS Display Manager, SAS Enterprise Guide (select HTML output), and even the SAS University Edition (SAS Studio).

tags: ods escapechar, proc format

New course: Developing Custom Tasks for SAS Enterprise Guide

$
0
0

This probably won't surprise any of my regular readers: "SAS custom tasks" is one of my favorite topics to talk about.

Since 2007, I've written blogs about how you can use custom tasks to extend SAS Enterprise Guide and the SAS Add-In for Microsoft Office. I've shared lots of examples, many that you can use simply "as-is" without any special technical knowledge. I presented a SAS Talks webinar on the topic. And I even wrote the book: Custom Tasks for SAS Enterprise Guide Using Microsoft .NET.

Now I'm ready to take this show on the road, and teach this topic in a classroom setting. I've built a new SAS course: Developing Custom Tasks for SAS Enterprise Guide.

I taught the course for the first time this past April. All new SAS courses go through a "test teach", in which internal SAS folks participate as students. The purpose of a test teach is to ensure that the course materials, software setup, and instructor are all up to the high standards for SAS Training offerings. In my test teach, I had students from Technical Support, R&D, Product Management, Education, and Professional Services. That's a pretty good mix, and I got some good feedback. At the end, we agreed that the course is ready for prime time.

Here are some high-level features that you can expect from the course:

  • It's a two-day course -- and we fill the time!
  • We cover the SAS APIs and toolkits that make custom tasks possible. We also cover best practices for design and build, which make it much easier to have successful custom task projects.
  • Students will get plenty of hands-on experience, some as instructor-led tutorials and some as independent lab exercises.
  • You will build a complete custom task, in class!
  • You don't need to be a SAS expert or Microsoft .NET expert coming in, but I recommend that you have base SAS programming experience and also experience with some object-oriented development tool, such as Microsoft Visual Studio (C# or Visual Basic) or Eclipse (with Java).
  • You should come having at least working knowledge of SAS Enterprise Guide.

If all of this sounds interesting to you, I hope to see you in a SAS training center in the near future! Check the SAS Training & Books web site for schedules and locations. (Note, this link is from the USA course catalog. Other countries might add the course later, based on interest. Hint, hint.)

tags: SAS custom tasks, sas training

Performance tips for viewing data in SAS Enterprise Guide

$
0
0

SAS users love to look at data. And the data grid in SAS Enterprise Guide is a convenient way to view the contents of a data set. While small data sets can be rendered lickity-split for quick viewing, sometimes people get justifiably anxious when opening very large data. Perhaps they've been burned with a bad experience, because opening a huge transaction table can hang up a system. When dealing with very large data, it's wise to be cautious.

In general, the SAS Enterprise Guide data grid can open and show data quickly, even if the data sets are very large. This is because the data grid does not read in all of the data records at once, but reads in only the records that are needed to fill the rows of the grid. The data grid uses a "virtual mode", which allows you to scroll quickly around your data set, no matter the size.

datagrid
In addition to the scroll bar, which shows you approximately where you are in the data set, there are a few keyboard shortcuts that can help you to navigate:

  • Ctrl+End - takes you to the last record, last column in the data set.
  • Ctrl+Home - takes you to the first record, first column in the data set.
  • Ctrl+G - brings up a "Go to" window, in which you specify exactly which record number to bring to the top of the view.

Note: The concept of "record number" is a specific to SAS data sets, since traditional SAS files store records sequentially. When you view a database table (accessed through a SAS/ACCESS library), the idea of "record number" might not make as much sense, since the database rules determine the sequence. However, you can still use the keyboard shortcuts to navigate your view.

Even for all of its built-in smarts, the data grid can still perform slowly in certain situations. If you're experiencing slow performance, here are some tips to help.

Understand your network latency. SAS Enterprise Guide retrieves data records from your SAS session, which is typically on another machine in your network. If your network connection is slow or the remote machine is very remote (such as in another country), fetching those records will take more time.

Avoid opening data unnecessarily. When you add data to your project, whether using File->Open Data or by running a task that produces output data, SAS Enterprise Guide will automatically open the data for viewing. Simply opening the data can cause a noticable delay when there is network latency or a slow database connection. If you're already familiar with the data and don't need to see the records every time, you can change this default behavior. From Tools->Options, select Data General and uncheck the option for "Automatically open data when added to the project."

Avoid scrolling through very wide data. As I stated earlier, large data isn't generally a problem in SAS Enterprise Guide. However, when the data are very wide, the grid can be slow. Why? Because even though the data grid reads only enough data records to fill the grid, it reads only entire records -- even if some of the variables in the record aren't visible on the screen at the time.

I define "wide" data as hundreds or thousands of variables, or maybe fewer variables that each have very large lengths. Consider these two LENGTH statements, each of which allocate 2000 variables but yield dramatically different record lengths:

/* 2000 numeric vars, 8 bytes each = 16,000 bytes per record */
/* a data set with just these fields can render quickly in SAS EG */
length x1-x2000 8;
 
/* 2000 character vars, 1000 bytes each = 2,000,000 bytes per record! */
/* a data set with these fields can really slow things down */
length c1-c2000 $ 1000;

Use the Data Explorer with care. The Data Explorer (added in SAS Enterprise Guide 5.1) is a popular new feature (see Marje Fecht's enthusiastic review). The Data Explorer can provide at-a-glance "Quick Stats" of variable distribution and frequency. However, the behind-the-scenes analyses that support those stats can be expensive for very large data. SAS Enterprise Guide sets some automatic constraints in order to limit the impact, but you should set your expectations accordingly.

Understand the special treatment for database tables. When you access data in a library using a SAS/ACCESS engine (for example, connecting to Oracle or Teradata), SAS Enterprise Guide automatically limits the data grid view to 10,000 records. You can configure that number in the application options, but the reason for the constraint is to limit the impact on the database connection and to keep your DBA happy (well, as happy as DBAs tend to be, anyway). 10,000 records should be enough for you to "eyeball" the shape of the data. If you need to see rows that meet specific criteria, consider using the Query Builder.

To paraphrase King Burger's Bon Qui Qui (from the famous MAD TV sketch): You can view your data your way, but don't get crazy. I hope that with a little knowledge about what happens behind the scenes, you can click through your data with more confidence.

tags: big data, data access, SAS Enterprise Guide, sas/access

More SAS tips coming to your inbox

$
0
0

When it comes to e-mail-based newsletters, I'm of two minds. On one hand, I feel like I receive enough (or maybe too much) e-mail and I'm reluctant to clog up my inbox with more stuff -- especially if it's information that's located elsewhere (such as on that big backup drive that we call "the Internet").

tipsextra_conceptBut on the other hand, I don't usually have time to go searching the Web for stuff that might someday be useful to me, or even to pay regular visits to the sources that I know will have good information (such as blogs and discussion forums). If someone collected some of the best tidbits from these sources and delivered them to me -- even in e-mail -- I think that would be useful. Do you agree?

We know from experience that SAS users love to see tips about how to do more with SAS. So we got to thinking: What if we curated an e-mail newsletter that was ALL SAS tips? Where all of the content was coming from the "hey, we bet you didn't know this" category?

We're making that happen, beginning this month. It's called SAS Tech Report: Tips Extra. It contains tips -- some from SAS staff and some from the larger SAS community -- to save you time and expand your mind. If you subscribe to the SAS Tech Report newsletter already, then do nothing -- you'll receive it automatically. If you don't yet subscribe, then visit the e-Newsletters section of www.sas.com and click the link to sign up. It's free, of course -- all you need is a SAS profile (which you probably already have if you participate in communities.sas.com or interact with SAS Technical Support).

I hope that you like the content, and that you appreciate it showing up in your inbox. And if you have feedback or ideas for topics to feature, let me know here in the comments.

tags: SAS support, SAS tips

How to find out what's new in SAS 9.4 maintenance

$
0
0

Today SAS began shipping the second maintenance release of SAS 9.4, colloquially known as "SAS 9.4M2". This is an incremental release, meant to build upon the already-solid SAS 9.4 platform. Even as a SAS insider, I cannot possibly keep track of every new feature that has been added in maintenance. But since I'm always on the hunt for interesting things to blog about, I find myself scanning the "What's New in SAS 9.4" document.

If you're coming from SAS 9.3 or earlier, then the entire "What's New" document is of interest to you. But if you're already using SAS 9.4 or even SAS 9.4 Maintenance 1, then you might be looking for the "9.4M2 Cliffs Notes". I'm afraid that the What's New document isn't structured that way -- it's organized by product and feature sets, and not chronologically by maintenance releases.

Fortunately, the document does call out the new features that have been added in each maintenance within the context of each product, and I've found a technique that helps me to find the highlights for M2. Here's what I do.

1. Visit the What's New section of support.sas.com. From here, I click on What's New in SAS 9.4 (HTML version).

2. From the Contents section, select the product of interest. For example, I'm very interested in Base SAS. Each release brings new statements, functions, ODS enhancements, and new statistical graphics -- all under the huge umbrella of "Base".

whatsnew94_prod
3. Use the browser "Find" feature to locate the word "second". The writers and editors at SAS are very consistent with their terminology standards, and that's a big help for me here. I know that in this What's New document, I can find the newest features by locating what's called out for "the second maintenance release for SAS 9.4". Simply searching for "second" helps me to find these.

whatsnew94_second
For example, I learned that SAS 9.4 offers enhancements to the new ODS EPUB and ODS HTML5 destinations. I'm interested in those because David Kelley demonstrated them at SAS Global Forum 2014.

The What's New in SAS 9.4 document contains only the highlights, but provides links to the documentation with more details. For example, the mention about the ODS HTML5 enhancements links to the SAS 9.4 Output Delivery System: User's Guide, which contains a more detailed view of what's new in ODS. From there, I can use the same browser trick to find mentions of "second" to see what was added to ODS in SAS 9.4M2.

The analytical products (such as SAS/STAT, SAS/IML, and SAS Enterprise Miner) make this a little bit easier by issuing new version numbers. The SAS 9.4M2 release of SAS/STAT is versioned as 13.2, and those new features are discussed in the SAS/STAT 13.2 section of the SAS 9.4 What's New document, with more details in the SAS/STAT documentation.

tags: documentation, SAS 9.4

Format your data like a social media superstar

$
0
0

In my industry of data and computer science, precision is typically regarded as a virtue. The more exact that you can be, the better. Many of my colleagues are passionate about the idea, which isn't surprising for a statistical software company.

But in social media, precision is a stigma -- especially when applied to the number of followers or connections that you have. Do you have so few connections that it can be represented as an exact number? Well, I wouldn't go bragging about that!

For example, let's look at this new LinkedIn joiner (blurred to protect his identity). As of this writing he has only -- and exactly -- 15 connections! (For the record, I consider this guy to be a rising star; I'm sure that his connections will skyrocket very soon.)

LinkedIn newcomer
Compare this to a more seasoned networker, shown below. LinkedIn won't tell us how many connections he has; perhaps they are beyond measure. We can see only that he has 500 or more LinkedIn connections. It might be 501 or it might be 500 million. It doesn't matter, according to LinkedIn. All you need to know is that this guy is a highly sought-after connection.

linkedin_pro
Let's create a SAS format to count connections, LinkedIn-style. It's simple: for cases of 500 or more, the label should be "500+". For fewer than 500, the label will be the embarrassingly precise actual number.

libname library (work); /* "library" is automatically searched for formats */
proc format lib=library;
 value linkedin    
  500 - high ='500+'
  /* all other values fall through to actual number */
 ;
run;
 
/* test data */
data followers;
  length name $ 40 followers 8 displayed 8;
  format displayed linkedin.;
  infile datalines dsd;
  input name followers;
  displayed = followers;
datalines;
Chris Hemedinger, 776
Kevin Bacon, 100543
Norman Newbie, 3
Colleen Connector, 499
;
run;

Here's the result. Notice how the "displayed" value acts as sort of an equalizer among the super-connected. Once you've achieved a certain magnitude of connections, you're placed on par with all other "superstars".
linkedin_data

Social sites like Instagram and Twitter operate on a different scale. While they still sacrifice precision when displaying a large number of "likes" or "followers", they do at least present a ballpark number that shows the magnitude of the activity. For example, instead of showing the exact follower count for Ronda Rousey (public figure, film star, MMA champ, and daughter of an experienced SAS presenter), Instagram simply truncates the number to the thousands and adds a "K".

rrig
To achieve the same in SAS, we can rely on a PICTURE format. This format contains the templates for what a number should look like, plus the multipliers to apply to get to the figure we want to display. Here's an example program, which I repurposed from the BIGMONEY example in SAS documentation.

proc format lib=library;
picture social (round)
 1E03-<1000000='000K' (mult=.001  )
 1E06-<1000000000='000.9M' (mult=.00001)
 1E09-<1000000000000='000.9B' (mult=1E-08)
 1E12-<1000000000000000='000.9T' (mult=1E-11);
run;
 
/* test data */ 
data likes (keep=actual displayed);
format actual comma20.
 displayed social.;
 do i=1 to 12;
  actual=16**i;
  displayed = actual;
  output;
 end;
run;

Here's the result:
socialcount_output

As you can see, the "displayed" values show you the magnitude of big "likes" in a cool-but-not-so-eagerly-precise way.

Here's my complete test program if you want to try it yourself. Happy networking!

tags: formats, LinkedIn, PICTURE formats, precision, social media

Experimenting with ODS EXCEL to create spreadsheets from SAS

$
0
0

The ODS ExcelXP tagset has served us well over the years. It provides a reliable method to get formatted SAS output into Microsoft Excel workbooks, where the business world seems to like to live. And it's available in Base SAS, which means that you don't need SAS/ACCESS to PC Files and any extra setup to begin using it.

In SAS 9.4 Maintenance 1, ODS EXCEL was introduced as an experimental feature. Even though it still has the "experimental" label in the recently released SAS 9.4M2, I've found it to be a useful addition to the many ways I can create Excel content from SAS. ODS EXCEL offers a couple of big advantages over ExcelXP:

ODS EXCEL produces a native XLSX file. Users of the ExcelXP tagset know that Excel complains about the file format as you open it. And the XML Spreadsheet format that it uses is uncompressed, resulting in potentially very large files.

ODS EXCEL supports SAS graphics in the output. ExcelXP users have come up with creative methods to insert graphs "after the fact", but it's not as convenient as a "once and done" SAS program. With ODS EXCEL, graphics from SAS procedures are automatically included in output.

Syntax-wise, ODS EXCEL is similar to ODS TAGSETS.ExcelXP. Chevell Parker shares many of those details in his SAS Global Forum 2014 paper; in absence of official doc for this experimental feature, Chevell's paper is essential.

Let's dive into an example. The following program looks similar to how you might use the ExcelXP tagset, but can you see the key differences?

ods excel file="c:\projects\output\example.xlsx" 
 /* will apply an appearance style */
 style=pearl
 options(
  /* for multiple procs/sheet */
  sheet_interval="none" 
  /* name the sheet tab */
  sheet_name="CARS summary"
 );
 
/* add some formatted text */
ods escapechar='~';
ods text="~S={font_size=14pt font_weight=bold}~Cars Summary and Histogram";
 
/* tabular output */
proc means data=sashelp.cars;
var msrp invoice;
run;
 
/* and a graph */
ods graphics / height=400 width=800 noborder;
proc sgplot data=sashelp.cars;
histogram msrp;
run;
 
ods excel close;

Note how I've targeted an XLSX file directly, instead of going through an XML intermediary file to placate Excel with the file format. And I included a graph with no problem. Like other ODS output destinations, I can apply styles and special formatting as needed. Here's a screen shot of the resulting spreadsheet:

odsexcel

I have a few additional observations from playing with this feature (did I say it was experimental?):

  • ODS EXCEL doesn't perform well with large detailed output. That is, if I use ODS EXCEL and PROC PRINT a data set with lots of columns and many thousands of rows, it's going to be slow -- and might hit a wall with memory usage. For that use case, PROC EXPORT DBMS=XLSX works better (though that requires SAS/ACCESS to PC FILES).
  • ODS EXCEL overwrites any existing Excel file that you target. That means that you aren't going to use this method to poke new values into an existing spreadsheet, or add sheets to an existing workbook. Compare that to PROC EXPORT DBMS=XLSX, which allows you to update an existing workbook by targeting just one sheet.
  • My example code works perfectly on the SAS University Edition! Simply change the destination file to be a location that SAS can write to -- for example, file="/folders/myfolders/example.xlsx".

If you want to learn more about the new ODS destinations in SAS 9.4 (which include HTML5, EPUB, POWERPOINT, and EXCEL), watch my interview and demo with David Kelley, R&D manager for ODS at SAS:

tags: excel, excel 2007, ods, ODS EXCEL, SAS 9.4, SAS University Edition

Using ODS EXCEL and PROC EXPORT to bundle Excel-based reports

$
0
0

I recently wrote about my foray into the experimental world of ODS EXCEL. Using this new destination in SAS 9.4, I was able to create multisheet workbooks -- containing reports and graphs -- in the XLSX format. I outlined some of the benefits -- such as being part of Base SAS and its ability to create native XLSX files. But I also pointed out some of the shortcomings that I experienced, such as slow performance with large amounts of data.

I'm working on a consulting project in which I needed to provide my client with an Excel-based report. This report requires an easy-to-read summary sheet, such as might be created with PROC MEANS and PROC TABULATE. That's a perfect job for ODS EXCEL. But I also needed to include subsequent sheets that contained different versions of detailed data -- tables with lots of columns and many thousands of rows. In my experience, this can bog down ODS EXCEL; I find that PROC EXPORT with DBMS=XLSX performs much better. So...I decided to see if I could combine the two approaches to create a single file.

The process worked perfectly for my purposes. It relies on the following behaviors/assumptions:

  • ODS EXCEL creates a new XLSX file. That's okay, because each time I run my process I want to replace the XLSX that I had before. If I wanted to retain previous versions, I could tack a date suffix onto the target file name.
  • PROC EXPORT with DBMS=XLSX can add/update a sheet within an existing XLSX file. That's a relatively recent feature, added in SAS 9.4 (and perhaps worked in SAS 9.3M2). This means that I can create the file with ODS EXCEL, then update the same file using PROC EXPORT, all within a single SAS program. (Remember, PROC EXPORT with DBMS=XLSX requires SAS/ACCESS to PC Files.)

I would like to show an example of the output, but I'm sure that my customer wouldn't approve of me featuring their data details on my blog. So instead I'll risk alienating a different group of acquaintances: my Facebook friends.

Years ago I built an app that turns your Facebook friend data into a SAS program. Even though eons have passed (in social media time), the app still works. (You can try it yourself: it runs as a custom task in SAS Enterprise Guide or as a standalone program on your Windows PC.) I ran it just now to gather my latest Facebook friend data and create SAS data sets with my friend details. Then I used ODS EXCEL to create a summary sheet, and PROC EXPORT to create several detailed sheets. Here's an example of the summary:
fbsummary

And then one of the detailed sheets, produced by PROC EXPORT of one of the detailed data sets my Facebook program created:
fbdetail

Here's the SAS program that produces this output. First, I run the program that is generated by my Facebook app. Then I follow up with this program that generates the Microsoft Excel spreadsheet file.

/* Create a new FB summary and report workbook for this snapshot 
   of Facebook data                                             */
filename fbout "c:\temp\FBReport_&SYSDATE..xlsx";
 
/* A little ODS style trick to make headings in my sheet */
ods escapechar='~';
%let bold_style=~S={font_size=12pt font_weight=bold}~;
 
/* CREATES a new XLSX file */
ods excel (id=fb) file=fbout
  /* choose a style you like */
  style=pearl
  /* SHEET_INTERVAL of NONE means that each PROC won't generate a 
     new sheet automatically                                     */
  options (sheet_interval="none" sheet_name="Summary")
  ;
 
ods noproctitle;
ods text="&SYSDATE. Friend Report for &myFacebookName";
proc sql;
     select count(distinct(UserId)) as 
         Number_Of_Friends into: NumberOfFriends
	 from friends;
quit;
 
ods text="&bold_style.Count of friends by gender";
proc freq data=frienddetails
	order=internal;
	tables gender / 
	nocum   
	scores=table;
run;
 
ods text="&bold_style.Calculated Ages based on Graduation years";
proc means data=ages
	min max mean median p99;
	var age;
	class how;
run;
 
ods graphics on / width=800 height=300;
ods text="&bold_style.Count of friends by Relationship Status";
proc freq data=frienddetails
	order=internal;
	tables relationshipstatus / 
	nocum   
	scores=table plots(only)=freqplot;
run;
 
ods excel (id=fb) close;
 
/* ADDS new SHEETS to the existing XLSX file */
proc export data=frienddetails
  dbms=xlsx
  outfile=fbout replace;
  sheet="Friend Details";
run;
 
proc export data=schoolfriends
  dbms=xlsx
  outfile=fbout replace;
  sheet="Schools";
run;
 
proc export data=statusprep(keep=name date message)
  dbms=xlsx
  outfile=fbout replace;
  sheet="Latest Status";
run;

I could achieve a similar result using other methods, of course. But I like to take advantage of my consulting opportunities to explore new features in SAS software. I find that if I can learn a new feature "on the job", I can produce a good result for my customer while also adding to my bag of SAS tricks.

Related articles

Experimenting with ODS EXCEL to create spreadsheets from SAS
How do I export from SAS to Excel files: Let me count the ways
Running PROCs on Your Facebook Friends (2011 version)

tags: excel, facebook, ODS EXCEL, PROC EXPORT, xlsx

Don't panic: maybe your XLSX file is already opened

$
0
0

As you can tell from my recent posts (see here and here), I've been working with SAS and Microsoft Excel files quite a bit. I'm really enjoying the ability to import an XLSX file in my 64-bit SAS for Windows without any additional setup.

After one long afternoon of back-and-forth between Excel and SAS, I ran into this alarming error message:

ERROR: Error opening XLSX file -> C:\Projects\MyData.xlsx .  It is either not 
an Excel spreadsheet or it is damaged.   Error code=80001019
Requested Input File Is Invalid
ERROR: Import unsuccessful.  See SAS Log for details.
NOTE: The SAS System stopped processing this step because of errors.
NOTE: PROCEDURE IMPORT used (Total process time):
      real time           0.00 seconds
      cpu time            0.00 seconds

It's a scary message, and I panicked -- but just briefly. I soon remembered that Microsoft Excel likes to place an exclusive file lock on spreadsheet, so if you have it open in Excel, nothing else will be able to read it. My file wasn't "damaged" -- it was simply in use.

I could wish for a better error message like: "Excuse me sir, but it appears that file is already opened by another application. Would you mind closing it so that we can read the data? I mean, whenever it's convenient for you."

Once I closed Microsoft Excel and reran my SAS program, all was good. Whew!

tags: excel, proc import, xlsx

New SAS programming features in SAS Enterprise Guide 7.1

$
0
0

SAS Enterprise Guide 7.1 began shipping last week. Of the many new features, some are "biggies" while others are more subtle. My favorite new features are those for SAS programmers, including several items that I've heard customers ask for specifically. I'll describe them briefly here; the SAS Enterprise Guide online help contains more details.

Track program history

This is one of the biggies. If you have SAS programs in your SAS Enterprise Guide project, you can now track your changes in those programs using standard source control management methods.

eg71_commit
You can "commit", view history, revert changes, compare versions, and even see an annotated "blame" view that shows exactly when you introduced a change that broke your program.

eg71_blame
The program history feature relies on a "hyperlocal" Git repository within your EGP file, so you can't use this to track changes to SAS programs that you store outside of the project. But SAS Enterprise Guide 7.1 also supports integration with a file-system-based Git repository if you set one up using other tools. The SAS integrated menus/tools will still help you to see your program's heritage.

eg71_newscm
Why Git? Functionally, it fits the purpose. And the SAS team was able to embed the necessary pieces within the application, so you don't need to install additional tools before getting started. And besides, all of the cool kids use Git these days. If you need to work with Subversion or another tool, you can still use this file-system technique.

Smart highlighting in the program editor

Double-click on a word in the editor to highlight it, and instantly see all other occurrences of that word highlighted in your program view. That's what puts the "smart" in "smart highlighting".

It's amazingly useful for finding all occurrences of a variable name, data set name, or an embarrassing misspelling.

eg71_smarthighlight

Project log summary window

The Project Log shows you a complete aggregated view of your SAS logs within your project; it's been part of SAS Enterprise Guide for several years. The log content is comprehensive, but often difficult to navigate because it holds so much. Now the popular Log Summary view (introduced in release 6.1) has made it to the Project Log, simplifying your journey through the log content.

eg71_projlogsummary

Project-level Search

The search for a "search" feature led me to create the EGP Search tool, which has been very popular among SAS Enterprise Guide "power users". Now there is a built-in search feature that allows you to search the current project for text in any project element, including tasks, programs, and results.

eg71find

(The built-in search feature doesn't search multiple project files, so my EGP Search tool isn't obsolete just yet.)

SAS Macro Variable viewer and SAS System Options viewer

Many SAS programmers have downloaded these two custom tasks from this blog. The macro variable viewer shows all of the current SAS macro variables and their values, plus allows a quick method to evaluate macro expressions. The system options viewer shows all of the SAS options, with their values and meanings. Thanks to the popularity of the custom tasks, the R&D team agreed to include them in the main application. These tasks are now "first-class citizens" on the Tools menu.

eg71_newtools

But wait, there's more

I look forward to discussing more new features, including: integration with SAS Studio tasks, with SAS Visual Analytics and the LASR server, some new UI niceties for finding tasks and organizing Favorites, and much more. It's a big release with plenty of treasures to find -- and even I'm still discovering them!

tags: Git, SAS Enterprise Guide, SAS programming, source control

Why your DDE programs don't work anymore

$
0
0

Hello, 1992 called. They want their DDE Excel automation back.

DDE broken?Perhaps the title of this article is too pessimistic. Of course your SAS programs that use DDE (dynamic data exchange) can still work perfectly, as long as you situate your SAS software and its DDE "partner" (usually Microsoft Excel) to run on the same Windows PC. DDE is still documented and supported in SAS 9.4.

But for the growing number of users who modernize to a centralized SAS environment, the legacy of DDE is a big challenge to bring forward. Your new environment might include the benefits of SAS Grid Computing, SAS Visual Analytics, stored processes, and more manageable security. You might run your SAS programs using SAS Enterprise Guide or even a web browser. But with all of that shiny new tech and its distributed architecture, the simple local arrangement that allows DDE to function...well, it falls apart.

Let's look at how DDE works. This data exchange relies on two consenting Windows processes, both running on a single machine, to communicate with each other using special Windows messages. In SAS programs, this usually takes the form of SAS spawning Microsoft Excel, sending a command to reference a particular cell or range of cells in a sheet, and poking in some values that were computed in SAS. If your SAS session is now running on a remote machine (often a non-Windows machine), then SAS cannot use DDE to talk to your local Microsoft Excel application. As the man says, "what we've got here...is failure to communicate."

For those customers who have a lot invested in DDE (some have hundreds of programs!) and no time/budget to adjust processes away from it, I usually recommend a simple stop-gap approach: maintain a designated machine with SAS for Windows to do your DDE grunt work, even as you move other processes to an enterprise SAS environment.

But going forward, I encourage customers to look at the alternatives supported by new features in SAS that are more in line with today's topology (SAS on a remote server, SAS Enterprise Guide or other local client on the PC). These features can replace many (but not all) of the legacy DDE uses that are out there.

DDE is still supported in Microsoft Excel. We cannot say for how long, as Microsoft has put more emphasis on VBA, .NET, or PowerShell for Excel automation instead. But since DDE works only between two Windows processes (SAS and Excel in this case) on the same machine, it's an outmoded approach that's incompatible with many IT setups.

Some DDE alternatives

The SAS Add-In for Microsoft Office offers the most flexible method for complete control over the format and structure of your spreadsheet. It turns the problem on its head: instead of relying on a batch SAS program to push content into Excel, you simply use Excel to pull your SAS content into the spreadsheet, exactly where and how you want it. You can use SAS stored processes to encapsulate whatever SAS operation you need.

Within the SAS Add-In, you can also use specific cells and ranges as input into stored processes; it's just as flexible to inject your Excel content into SAS.

You can use Office scripting to automate the process (like a batch job), so the process can happen unattended. The consumers of your Excel documents do not need the SAS Add-In for Microsoft Office in order to view the results.

I know that not everyone is lucky enough to have the SAS Add-In. For batch SAS users, ODS tagsets.ExcelXP -- or its SAS 9.4 descendant ODS EXCEL -- can be used to place formatted report content into an Excel spreadsheet. Here's an example use for ODS EXCEL, which works as a "one-way" push from SAS into Excel.

Also, PROC EXPORT now supports adding sheets to existing files, or replacing entire sheets in place. That's flexibility that didn't exist before, when some users turned to DDE to fill the gap.

Aside from these SAS-centric approaches, creative programmer types can use script (VBS, PowerShell, and other) to plug their SAS data results into a spreadsheet as a post-process (which many customers spawn within their SAS programs).

Thinking of DDE as technical debt

Weaning yourself off of DDE is easier said than done, I'll admit. Twenty years ago DDE was a boon for SAS developers who needed to deliver Excel content to picky constituents. I played my part: I wrote the SAS Companion for Microsoft Windows (Release 6.11!) and crafted some of the examples that still exist in the documentation.

However, I now consider DDE programs to be a form of "technical debt" that organizations will have to pay off sooner or later.

If your "DDE bill" hasn't come due yet, you're fortunate. But if you're planning to write another SAS program that relies on DDE, consider the future generations. Today's kids are writing SAS programs in iPads and web browsers, and DDE is about as hip as a rotary-dial phone. (Yes, it still works, but it does make your fingers tired.)

tags: DDE, dynamic data exchange, excel, SAS Add-In for Microsoft Office, SAS Enterprise Guide

Using SAS Enterprise Guide with your local SAS installation

$
0
0

serverlist_withlocalIf you have SAS Enterprise Guide and SAS for Windows installed on a machine together, they should Just Work. There is no special setup required. But...what if they don't?

I've posted an article in the SAS Enterprise Guide community about this topic. Read the article to learn:

  • How to select "No profile" mode in SAS Enterprise Guide.
  • How to add your Local SAS into the mix when you're connected to a SAS Metadata environment
  • How to "fix" your local system when SAS Enterprise Guide can't find your local SAS installation.

See the full article >> Using SAS Enterprise Guide with your local SAS installation

If you find the article to be helpful, please give it a rating. (You will need to sign in with your SAS profile to add a rating.) Positive ratings will make it easier for other users to find the information. And if you think the article needs something else to make it more useful, leave a comment on the article or here on the blog.

Side note about Communities on SAS

I've always been a big fan of the Communities on SAS, where thousands of SAS practitioners interact to learn from each other. A good number of SAS employees also participate in the discussions, which means that many of the answers about SAS technology are coming directly from the developers who created it. But it's your participation that makes the communities rich and engaging.

And now I have a more professional interest in the communities, as I've just moved into the role of managing our SAS Online Communities program. My team of community managers would love to hear from you about what you like and what you think could be improved. We have big plans for the communities program, and your input is essential to help us build the space where you want to spend your time. Post back in the comments here, or send us your feedback using this form (select Discussion Forums or Communities as the category).

tags: SAS Communities, SAS Enterprise Guide, SAS for Windows

SAS employees are now easier to spot on Communities

$
0
0

Since the launch of Communities on SAS, hundreds of SAS employees have been among you. Some SAS employees made themselves known by selecting a telling user name (such as Cynthia@SAS), but others remained camouflaged or incognito, keeping their secret identities like the SAS superheroes they are.

That's about to change. This week, we are revealing all SAS staffers on the Communities by changing their status indicators to "SAS Employee", featuring the familiar SAS logo. We're making this change to help make Communities on SAS more valuable and relevant to you. We know that you enjoy interacting with SAS employees here; now you'll have a clearer view into when that's happening.

You'll see this take effect in several places. For example, for the communities that have a "Top Participants" roll, you might see some SAS folks appear in the list:

sasemp_statusroll
When you hover your mouse cursor over a user name, or drill down to see more details about a community member, you will also see the "SAS Employee" designation.

sasemp_user
With the introduction of the "SAS Employee" status, you will no longer see the familiar "rank" status for these users. So you won't be able to tell -- at a glance -- whether a SAS Employee has achieved Expert, Master, or merely Novice levels of contribution. We hope that you'll appreciate all SAS employees as experts in their respective areas, even if the ranking isn't spelled out for you.

We hope that you enjoy the change. If you have feedback or ideas, please let us know!

tags: SAS Communities

How to split one data set into many

$
0
0

splitdataBack in the day when the prison system forced inmates to perform "hard labor", folks would say (of someone in prison): "He's busy making little ones out of big ones." This evokes the cliché image of inmates who are chained together, forced to swing a chisel to break large rocks into smaller rocks. (Yes, it seems like a pointless chore. Here's a Johnny Cash/Tony Orlando collaboration that sets it to music.)

SAS programmers are often asked to break large data sets into smaller ones. Conventional wisdom says that this is also a pointless chore, since you can usually achieve what you want (that is, process a certain subset of data) by applying a WHERE= option or FIRSTOBS=/OBS= combination. Splitting a data set creates more files, which occupy more disk space and forces more I/O operations. I/O and disk access is often the most expensive part of your SAS processing, performance-wise.

But if the boss asks for broken-up data sets, you might as well spend the least possible effort on the task. Let's suppose that you need to break up a single data set into many based on the value of one of the data columns. For example, if you need to break SASHELP.CARS into different tables based on the value of Origin, the SAS program would look like:

DATA out_Asia;
 set sashelp.cars(where=(origin='Asia'));
run;
DATA out_Europe;
 set sashelp.cars(where=(origin='Europe'));
run;
DATA out_USA;
 set sashelp.cars(where=(origin='USA'));
run;

I'm going to admit right now that this isn't the most efficient or elegant method, but it's something that most beginning SAS programmers could easily come up with.

Writing the above program is easy, especially since there are only 3 different values for Origin and I've memorized their values. But if there are more discrete values for the "split-by" column, the task could involve much more typing and has a high possibility for error. This is when I usually use PROC SQL to generate the code for me.

If you've read my article about implementing BY processing for an entire SAS program, you know that you can use PROC SQL and SELECT INTO to place data values from a data set into a macro variable. For example, consider this simple program:

proc sql;
 select distinct ORIGIN into :valList separated by ',' from SASHELP.CARS;
quit;

It creates a macro variable VALLIST that contains the comma-separated list: "Asia,Europe,USA".

But we can use SAS functions to embellish that output, and create additional code statements that weave the data values into SAS program logic. For example, we can use the CAT function to combine the values that we query from the data set with SAS keywords. The results are complete program statements, which can then be referenced/executed in a SAS macro program. I'll share my final program, and then I'll break it down a little bit for you. Here it is:

/* define which libname.member table, and by which column */
%let TABLE=sashelp.cars;
%let COLUMN=origin;
 
proc sql noprint;
/* build a mini program for each value */
/* create a table with valid chars from data value */
select distinct 
   cat("DATA out_",compress(&COLUMN.,,'kad'),
   "; set &TABLE.(where=(&COLUMN.='", &COLUMN.,
   "')); run;") into :allsteps separated by ';' 
  from &TABLE.;
quit;
 
/* macro that includes the program we just generated */
%macro runSteps;
 &allsteps.;
%mend;
 
/* and...run the macro when ready */
%runSteps;

Here are the highlights from the PROC SQL portion of the program:

  • SELECT DISTINCT ensures that the results include just one record for each unique value of the variable.
  • The CAT function concatenates a set of string values together. Note that CATX and CATS and CATT -- other variations of this function -- will trim out white space from the various string elements. In this case I want to keep any blank characters that occur in the data values because we're using those values in an equality check.
  • The program calculates a name for each output data set by using each data value as a suffix ("OUT_dataValue"). SAS data set names can contain only numbers and letters, so I use the COMPRESS function to purge any invalid characters from the data set name. The 'kad' options on COMPRESS tell it to keep only alpha and digit characters.
  • The resulting program statements all end up in the &ALLSTEPS macro variable. I could just reference the &ALLSTEPS variable in the body of the SAS program, and SAS would run it as-is. Instead I chose to wrap it in the macro %runSteps. This makes it a little bit easier to control the scope and placement of the executable SAS program statements.

"By each value of a variable" is just one criterion that you might use for splitting a data set. I've seen cases where people want to split the data based on other rules, such as:

  • Quantity of observations (split a 3-million-record table into 3 1-million-record tables)
  • Rank or percentiles (based on some measure, put the top 20% in its own data set)
  • Time span (break up a data set by year or month, assuming the data records contain a date or datetime variable)

With a small modification, my example program can be adapted to serve any of these purposes. What about you? Are you ever asked to split up SAS data sets, and if so, based on what criteria? Leave a comment and tell us about it.

tags: data management, macro programming, PROC SQL, SAS programming

Can you learn how to create custom tasks?

$
0
0

To develop a custom task for use in SAS Enterprise Guide (or SAS Add-In for Microsoft Office), you need a few things:

  • A working knowledge of SAS and SAS Enterprise Guide
  • Microsoft Visual Studio (the free Express edition will do, though the Professional edition is better)
  • Some experience with C# or Visual Basic -- or at least with an object-oriented framework such as Java or C++.

It helps to have a "how to" guide, and I've written one of those. And if you're the sort of person who learns best in the classroom, you can now take a class.

Are you wondering whether the class right for you? Watch this video (about 4 minutes long, in which I do my best Troy McClure impersonation). I'll explain what custom tasks are and what you need to know in order to build them. I'll also explain what you can expect to learn from the class, and the skills you should have before you enroll.


To enroll:
Visit the support.sas.com SAS Training site and find an offering that works with your schedule and location.

tags: .net, SAS custom tasks, sas training

Project Reviewer task and Copy Files task: refreshed for v7.1

$
0
0

Two popular SAS custom tasks have recently been updated for SAS Enterprise Guide 7.1. Most custom tasks that I've shared will work without modification across releases, but these two required a special rebuild due to some internal product API changes.

The Project Reviewer task allows you to see a detail view of the tasks/programs within your SAS Enterprise Guide process flows. The listing shows the task names and types, when they were added to the project and last modified, and how much time they take to run. You can also create a SAS-based ODS report from the data, which is a great way to use SAS Enterprise Guide to report on your SAS Enterprise Guide project. (Wow, that's so meta!)

projectrev71
Download Project Reviewer: See this blog post for more information and download link

The Copy Files task is used to move files from your local PC to your SAS session, or from your SAS session to your local PC. This allows you to capture these file transfer steps within your process flow so that they are repeatable. The task supports the use of macro variables and wildcards, which gives you lots of flexibility when designing a process in which the file names and quantities are subject to change.

Copy Files task
Download Copy Files: See this blog post for more information and download link

If you use these tasks (or other custom tasks) and find them useful, please leave a comment! I love to hear how the tasks are being used. And sometimes useful custom tasks find their way into the actual product in a future release. Your feedback is important to help to make that happen.

Other related articles

tags: Copy Files, process flows, SAS custom tasks, SAS Enterprise Guide

How to compare SAS programs in SAS Enterprise Guide

$
0
0

Copy/paste is my favorite method for creating new SAS programs. In my work projects, I maintain a sort of genealogy of SAS programs, because the DNA of one program can be used to spawn many other SAS programs as its progeny. When things (inevitably) aren't working as I intend in one of these next-generation programs, I find that I need to compare that program against the original to see what I've missed.

My file-comparison tool of choice is WinMerge. It's free and easy to install and use. That's why I'm really pleased with the new Compare Programs feature in SAS Enterprise Guide 7.1.

Here is how you set it up.

1. Install a file comparison tool.

I like WinMerge. But some of my colleagues prefer Beyond Compare or KDiff. Your choice! Most of these tools can integrate with your file system so that you can compare any two files from Windows Explorer. They also integrate with source control systems, if you use those (Git, Subversion, etc.).

2. Set your File Comparison options in SAS Enterprise Guide

Select Tools->Options, then the File Comparison tab. Check "Use custom file comparison tool" and then select your tool of choice. There are built-in presets for the three comparison tools that I mentioned, or you can go "off road" and select your favorite with "Other".

Select your DIFF tool

3. Select the two files that you want to compare

In the Project Tree or Process Flow, you can select multiple programs by using the standard Ctrl+Click sequence or by "rubber banding" a selection with the mouse (Process Flow only). When you have exactly two programs selected, right-click and select Compare.

Compare programs menu
The comparison tool launches with the contents of each program loaded for comparison. Here's what mine looks like:

Code compare in action
Some additional notes:

  • The content you see in the comparison tool is a copy of your program. Therefore, if you use the comparison tool to make changes, these won't be reflected in your SAS Enterprise Guide project. Of course, you can copy the changed content to the Windows clipboard and paste it into the SAS Enterprise Guide program editor.
  • You can do more with file comparison when using the Program History feature, which I introduced in this blog post about new programming features in SAS Enterprise Guide 7.1.
tags: SAS Enterprise Guide, SAS programming, WinMerge

The post How to compare SAS programs in SAS Enterprise Guide appeared first on The SAS Dummy.

How to convert a Unix datetime to a SAS datetime

$
0
0

timeI watched with wonder as each of my daughters learned how to "tell time." Early in their primary school careers, they brought home worksheets that featured clock faces with big-hand/little-hand configurations that they had to decipher, and exercises that asked them to draw the hands as they should appear given a specific elapsed time. Now my daughters have digital watches, and have even adopted my habit of wearing them with the face on the underside of the wrist and setting the display to 24-hour time -- which serves to confound their friends.

But, to my disappointment, their school has failed to teach my daughters how to read a SAS datetime value, or even the more ubiquitous Unix (POSIX) datetime value. As a parent of the 21st century, I feel it is my duty to fill this gap in their education.

First, let's review how these datetime values are represented:

  • A SAS datetime value is the number of seconds that have elapsed since midnight of January 1, 1960 (01JAN1960:00:00:00).
  • A Unix (or POSIX) datetime value is the number of seconds* that have elapsed since midnight of January 1, 1970 (01JAN1970:00:00:00).

Conversion from Unix to SAS representation is simple math:

/* Number of seconds between 01JAN1960 and 01JAN1970: 315619200 */
sasDT = unixDT + 315619200;

Having trouble remembering that 9-digit constant? Then you can get SAS to infer that part for you and use the dhms() function:

/* DHMS function calculates datetime when you provide values for */
/*    date, hour, minute, and seconds                            */
/* In this case, "seconds" is a very high value!                 */
sasDT = dhms('01jan1970'd, 0, 0, unixDT);

Raw Unix times are often expressed as UTC, and you might prefer to show local times in your SAS reporting. That's a simple calculation with the (undocumented) gmtoff() function:

/* Convert from UTC to local time using GMTOFF */
sasDT = dhms('01jan1970'd,0,0, unixDT + gmtoff());

Update: Bruno told me that TZONEOFF is an official SAS function in SAS 9.4! See the comments for more details how you can use it instead of GMTOFF.

I have one more variation that I use every day. I have a project that reports against a database that stores transaction times in milliseconds instead of seconds. (This uses the database's intrinsic int8 or BIGINT type.) SAS datetime values can represent fractions of seconds, so this conversion simply requires that I divide by 1000. I can use a different SAS datetime format to see the precision (if that's what I want, though it's usually not).

/* for more precision */
format sasDT datetime22.3; 
/* mlliseconds from transaction database */
unixDTms = 1429193343362;
sasDT_ms = dhms('01jan1970'd,0,0, unixDTms/1000);
/* result: 16APR2015:14:09:03.362 */

Here's a complete program that you can experiment with:

data t;
  format sasDT_const 
    sasDT_dhms 
    sasDT_local datetime20.;
 
  /* for more precision */
  format sasDT_ms datetime22.3;
 
  /* Unix test datetime of 16APR2015:14:09:03 UTC */
  unixDT =   1429193343;
 
  /* mlliseconds from transaction database */
  unixDTms = 1429193343362;
 
  /* Number of seconds between 01JAN1960 and 01JAN1970: 315619200 */
  sasDT_const = unixDT + 315619200;
 
  /* DHMS function calculates datetime given values for */
  /*    date, hour, minute, and seconds                 */
  /* In this case, "seconds" is a very high value!      */
  sasDT_dhms = dhms('01jan1970'd,0,0,unixDT);
 
  /* converting a value from milliseconds */
  sasDT_ms = dhms('01jan1970'd,0,0,unixDTms/1000);
 
  /* Convert from UTC to local time using GMTOFF */
  /* use TZONEOFF function in 9.4! */
  sasDT_local = dhms('01jan1970'd,0,0,unixDT + gmtoff()); 
run;

Sample output from this program (which I ran from my EDT timezone):
time_out
* I intentionally avoided any discussion of leap seconds that go along with UTC, but you can learn more about that here.

See also

Read a Microsoft datetime value into a SAS datetime value

tags: date-time, SAS programming, utc

The post How to convert a Unix datetime to a SAS datetime appeared first on The SAS Dummy.

Using FILENAME ZIP to unzip and read data files in SAS

$
0
0

I've written about how to use the FILENAME ZIP method to read and update ZIP files in your SAS programs. The ZIP method was added in SAS 9.4, and its advantage is that you can accomplish more in SAS without having to launch external utilities such as WinZip, gunzip, or 7-Zip.

Several readers replied with questions about how you can use the content of these ZIP files within your SAS program. The basic scenario is: "I've got some data files in my ZIP archive. I want to use SAS to unzip these and then use them as data within my SAS process. Can I do this?"

Yes, you can -- but it does require an extra step. Even though FILENAME ZIP can show you the contents and structure of your ZIP file, most SAS procedures cannot access the content directly while it's in the archive. So, the additional step is to copy the file to another location, effectively extracting it from the ZIP file.

As an example, I created a ZIP file with two files and a subfolder:

data.zip
  |__ sas_tech_talks_15.xlsx
  |__ sas/
      |__ instanttitles.sas7bdat

This SAS program helps me to discover how FILENAME ZIP sees the file:

filename inzip ZIP "c:\projects\data.zip";
 
/* Read the "members" (files) from the ZIP file */
data contents(keep=memname isFolder);
 length memname $200 isFolder 8;
 fid=dopen("inzip");
 if fid=0 then
  stop;
 memcount=dnum(fid);
 do i=1 to memcount;
  memname=dread(fid,i);
  /* check for trailing / in folder name */
  isFolder = (first(reverse(trim(memname)))='/');
  output;
 end;
 rc=dclose(fid);
run;
 
/* create a report of the ZIP contents */
title "Files in the ZIP file";
proc print data=contents noobs N;
run;

Output:

        Files in the ZIP file                                         
 memname                       isFolder
 sas/                             1  
 sas/instanttitles.sas7bdat       0  
 sas_tech_talks_15.xlsx           0  
                N = 3

With this information, I can now "copy" the XLSX file out of the ZIP file and then import it into a SAS data set. Notice how I can use the "member" syntax (fileref with the file I want in parentheses) to address a specific file in the ZIP archive. I want to copy just from the actual files, and not the folder-level entries.

/* identify a temp folder in the WORK directory */
filename xl "%sysfunc(getoption(work))/sas_tech_talks_15.xlsx" ;
 
/* hat tip: "data _null_" on SAS-L */
data _null_;
   /* using member syntax here */
   infile inzip(sas_tech_talks_15.xlsx) 
       lrecl=256 recfm=F length=length eof=eof unbuf;
   file   xl lrecl=256 recfm=N;
   input;
   put _infile_ $varying256. length;
   return;
 eof:
   stop;
run;
 
proc import datafile=xl dbms=xlsx out=confirmed replace;
  sheet=confirmed;
run;

Sample output from my SAS log:

NOTE: The infile INZIP(sas_tech_talks_15.xlsx) is:
      Filename=c:\projects\data.zip,
      Member Name=sas_tech_talks_15.xlsx

NOTE: UNBUFFERED is the default with RECFM=N.
NOTE: The file XL is:
      Filename=C:\SAS Temporary Files\_TD396_\Prc2\sas_tech_talks_15.xlsx,
      RECFM=N,LRECL=256,File Size (bytes)=0,
      Last Modified=11May2015:11:38:59,
      Create Time=11May2015:11:20:23

NOTE: A total of 55 records were read from the infile library INZIP.
NOTE: 55 records were read from the infile INZIP(sas_tech_talks_15.xlsx).
NOTE: DATA statement used (Total process time):
      real time           0.00 seconds
      cpu time            0.00 seconds

To use the SAS data set in the file, I need to copy it into a location shared by a SAS library. In this example, I will again use the WORK location. Because my SAS data set is in a logical subfolder (named "sas") within the archive, I need to include that path as part of the member syntax on the INFILE statement.

/* Copy a zipped data set into the WORK library */
filename ds "%sysfunc(getoption(work))/instanttitles.sas7bdat" ;
 
data _null_;
   /* reference the member name WITH folder path */
   infile inzip(sas/instanttitles.sas7bdat) 
	  lrecl=256 recfm=F length=length eof=eof unbuf;
   file   ds lrecl=256 recfm=N;
   input;
   put _infile_ $varying256. length;
   return;
 eof:
   stop;
run;
 
proc contents data=work.instanttitles;
run;

Partial output in my example:

                             Files in the ZIP file                          
                             The CONTENTS Procedure

 Data Set Name        WORK.INSTANTTITLES            Observations          1475
 Member Type          DATA                          Variables             6   
 Engine               V9                            Indexes               0   
 Created              01/29/2015 15:09:54           Observation Length    248 
 Last Modified        01/29/2015 15:09:54           Deleted Observations  0   
 Protection                                         Compressed            NO  
 Data Set Type                                      Sorted                NO  
 Label                                                                        
 Data Representation  WINDOWS_64                                              
 Encoding             wlatin1  Western (Windows)                              

Of course, all of this can be automated even further by writing SAS code that automatically iterates through the ZIP file member names and copies/imports each of the members as needed.

tags: Copy Files, FILENAME ZIP, SAS 9.4, ZIP files

The post Using FILENAME ZIP to unzip and read data files in SAS appeared first on The SAS Dummy.

Filter your SAS Enterprise Guide data with a WHERE clause

$
0
0

Are you a VIEWTABLE fan from the SAS Windowing Environment (a.k.a. Display Manager, DMS, PC SAS)? If so, the latest version of SAS Enterprise Guide has a new feature that you'll love.

With the latest update to SAS Enterprise Guide 7.1 (7.11), you can now subset your data in the data grid by typing a WHERE clause filter. The new Where button appears at the top of the data grid.

Simply click the button, and type a filter expression into the text field. Hit the Enter key to apply the filter:

where_ex1
Just as you might expect from SAS, you can build more complex expressions too. For example, you can transform the variable that you're comparing to lower case so that case-insensitive filters are easier to build:

where_ex2
And if you have continuous variables such as a date variable, you can subset by using BETWEEN to specify the boundaries you want to see:

where_ex3
Or transform that continuous range to a category (such as a YEAR) with a SAS function, on the fly:

where_ex4

SAS Enterprise Guide has always allowed you to subset data easily, but only by adding a step in the process flow (either a Query Builder task or Filter and Sort task). Now, you can accomplish this "in place", saving time and storage as you explore. Let us know what you think of the new feature -- either here in the blog comments or within the SAS Enterprise Guide community.

tags: SAS Enterprise Guide

The post Filter your SAS Enterprise Guide data with a WHERE clause appeared first on The SAS Dummy.

Viewing all 234 articles
Browse latest View live